Outcomes Framework - Metric Details
By clicking on the name of a metric on the Metric Dashboard, you can see details of a specific metric.
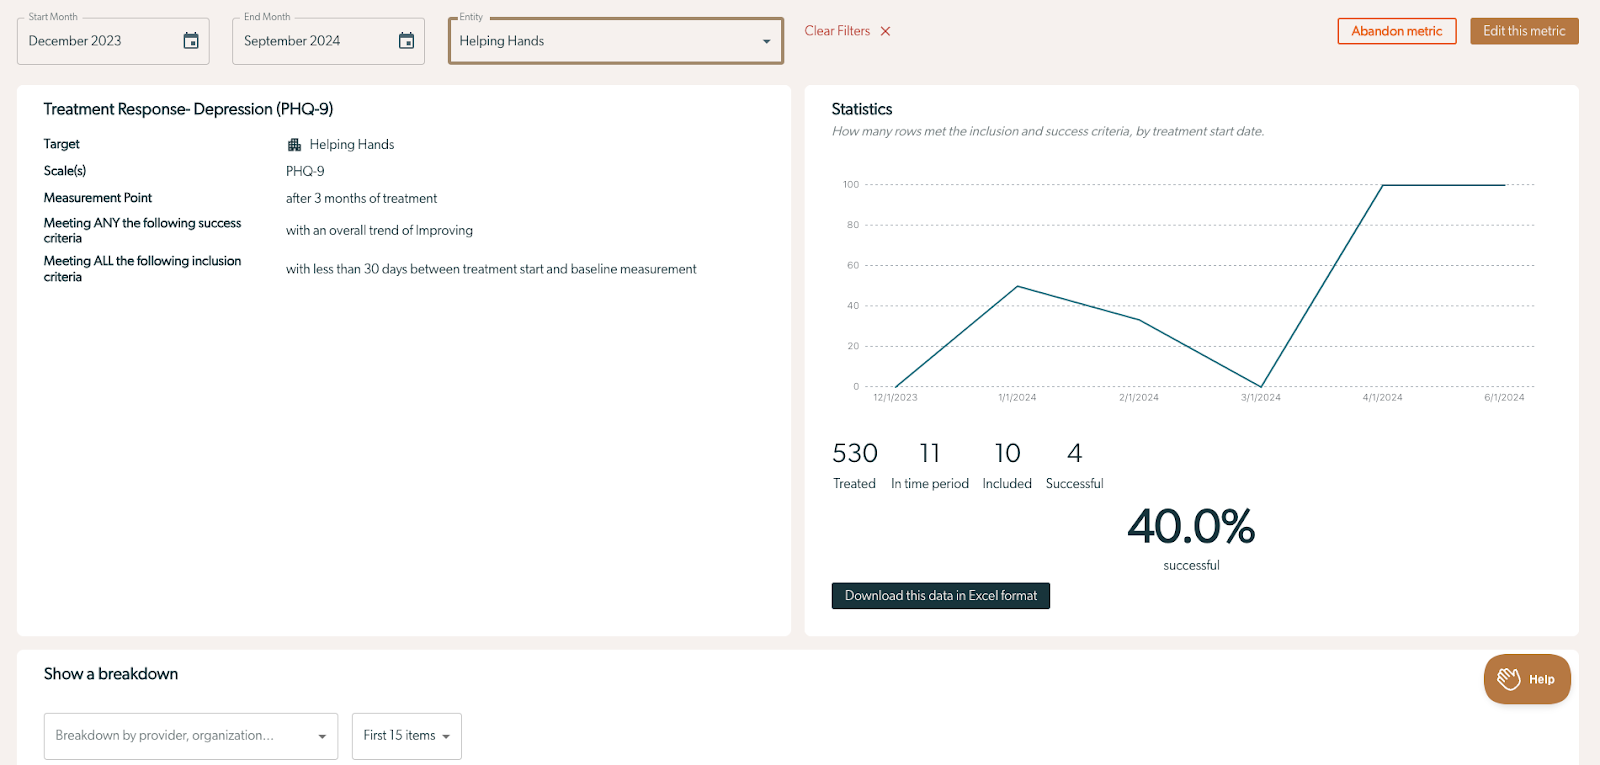
Similar to the Dashboard, you can select one of several controls to change what data you see:
- You may change the cohort of data by changing the "Start Month" or "End Month". This applies to the month of the start of the Treatment Episode, so don’t expect to see data for the current month yet.
- You may select an "Entity" to focus on. This will change the graph to show data only for that entity. For example, if you select a provider, it will show you data only that provider.
- Learn more about Entities here.
To the left, you can see the details of the metric. Depending on the type of metric, different details will appear:
- Target: Entity selected.
- Scale(s): Scales included. Can be one or multiple.
- Time Period: Get a description of the metric, including the exact criteria used. Details here.
- Success Triggers: (only Effectiveness Metrics) Triggers selected.
- Meeting ANY of the following Success Criteria: (only Efficiency Metrics) Success Criteria selected.
- Meeting ALL the following Inclusion Criteria: Inclusion Criteria selected.
Combined metrics will show the details for each individual metric in the combination. The titles of the individual metrics link to those metrics if you want to view them isolation.
To the right, see the Statistic graph and button to Download your Data to Excel
The Statistics show a funnel of metrics which are details about how the Statistic is calculated. Learn about the Metric Statistics here.
Below, see the section title Show a breakdown
Learn about how this breakdown works here.
Note that downloads and breakdowns are not available for combined metrics. To download metric data or see the breakdowns, use the links in the details section to view the individual metrics.